

Estate Planning Flowcharts: Using Visual Diagrams to Win Clients

Estate planning is one of the most valuable services financial advisors can offer, but it’s also one of the most difficult to make relevant and tangible during a client meeting.
For many families across the wealth spectrum, estate documents already exist, created by their attorneys. But showing clients what those plans mean in the context of their full financial picture is challenging, and doing so in a way that’s simple, actionable, and engaging is even harder.
Estate planning flowcharts do the heavy lifting, surfacing relevant data from dense legal documents and helping clients immediately understand the impact of the information on their financial plan, their family, and their legacy.
| What is an estate planning flowchart?
An estate planning flowchart is a visual diagram that maps how a client’s estate is structured: who owns what, who controls it, where assets are distributed at death, and what the tax impact looks like. Instead of working from documents, the advisor can pull up a single view that connects the estate plan to the broader financial picture. Importantly, these visualizations are valuable for clients at every level of wealth. Whether illustrating a straightforward beneficiary structure or a complex trust strategy, flowcharts make planning more accessible and understandable. |
Three critical conversations supported by estate planning flowchart software
Estate planning visualizations built from the client’s real data, including their assets, family structure, and plan documents, help advisors answer the questions clients ask most often:
1. Where does everything go when I die?
Even for clients with a complete, up-to-date estate plan, this can be difficult to answer using legal documents alone. A distribution view that illustrates, by beneficiary, trust, and asset type, exactly where everything goes after the first and second death brings clarity to this major unknown. Vanilla transcends conceptual graphics to show with specificity and users can toggle between spouses to show how the first death changes the picture.
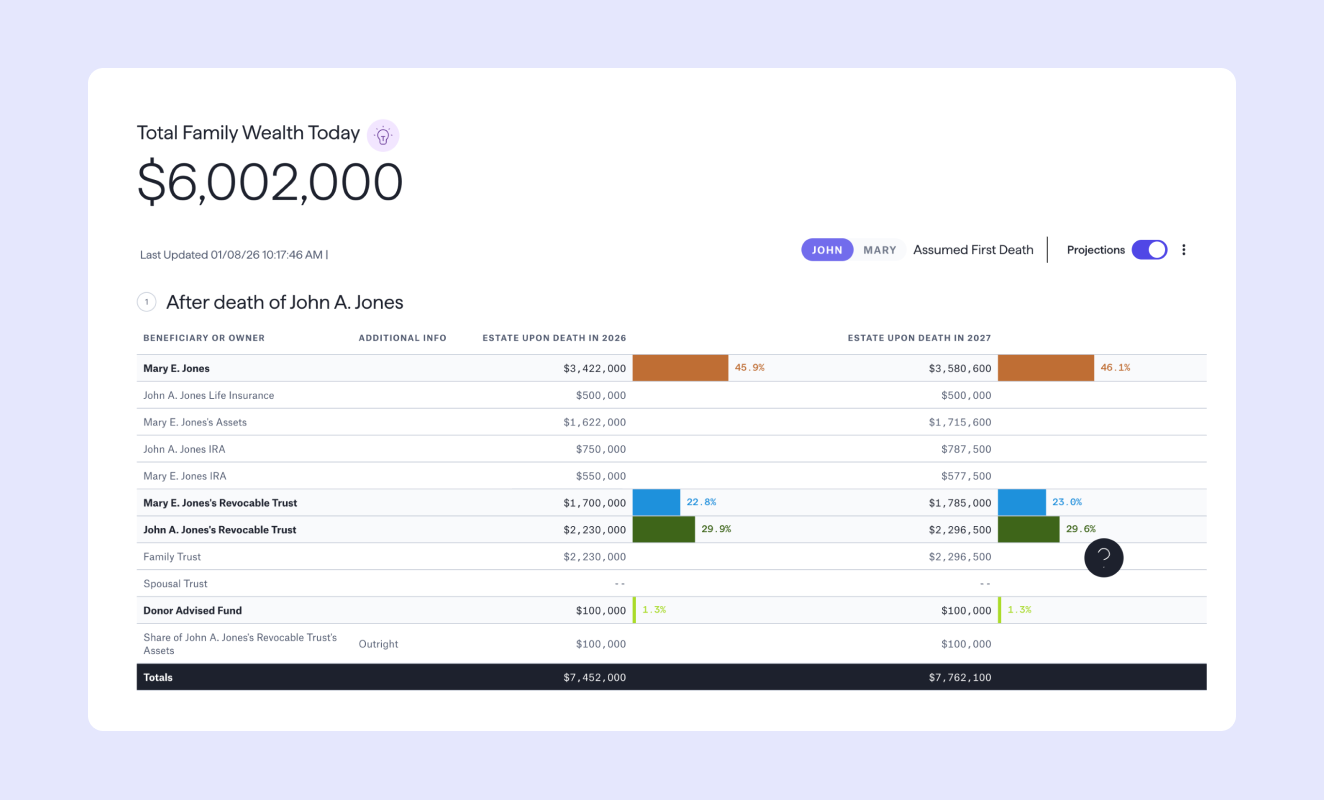
For example: At John’s first death, $3.4 million is held in Mary’s name outright, $1.7 million remains within her revocable trust, and $2.2 million passing through John’s revocable trust funds the Family Trust after a $100,000 distribution to a Donor Advised Fund.
2. How is the estate structured?
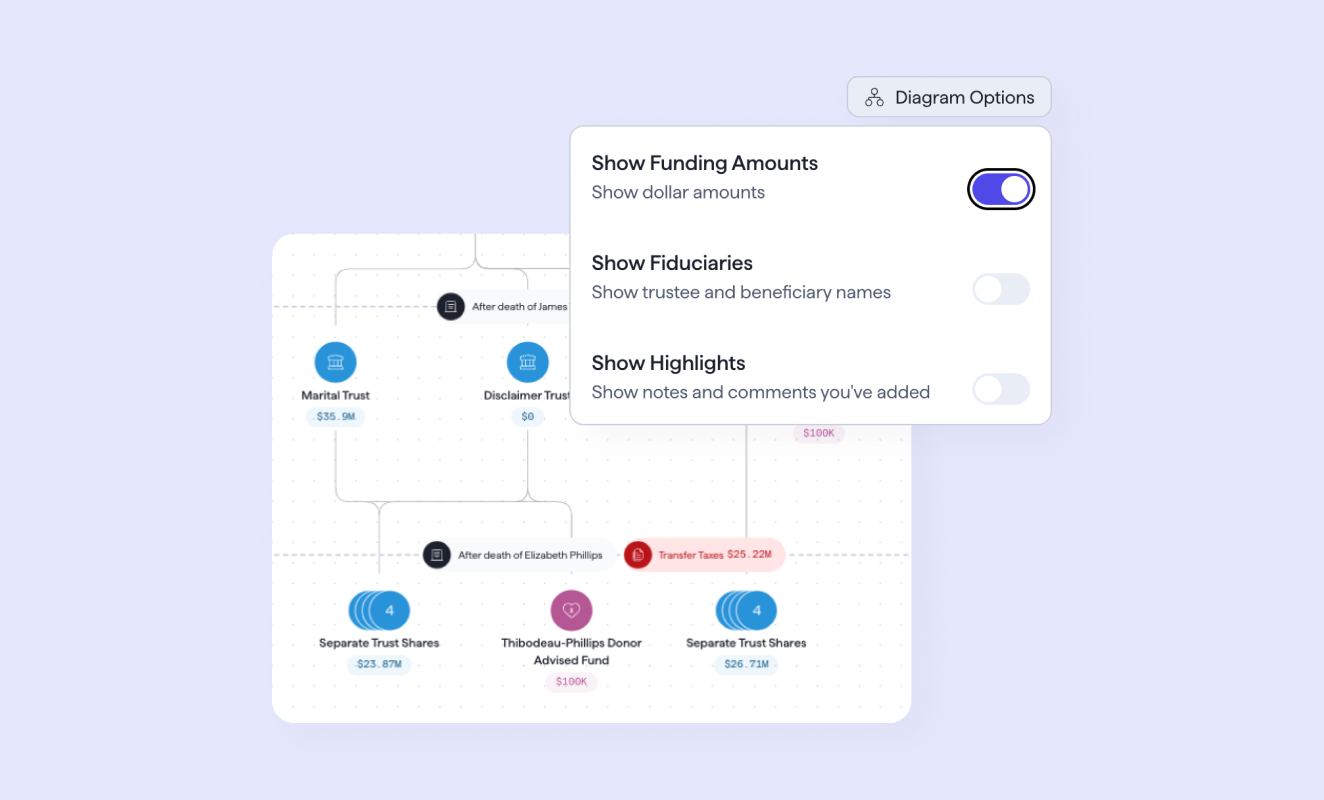
Trust structures are difficult to explain using words alone. Who controls what, how and where assets flow at each death, where the transfer tax hits – it’s a lot to juggle at once without a visual bringing everything together. Advisors using Vanilla can map the structure and call out tax exposure directly, layering in funding amounts, trustee and beneficiary names, and their own notes to give clients even more context.
3. What does the full picture look like?
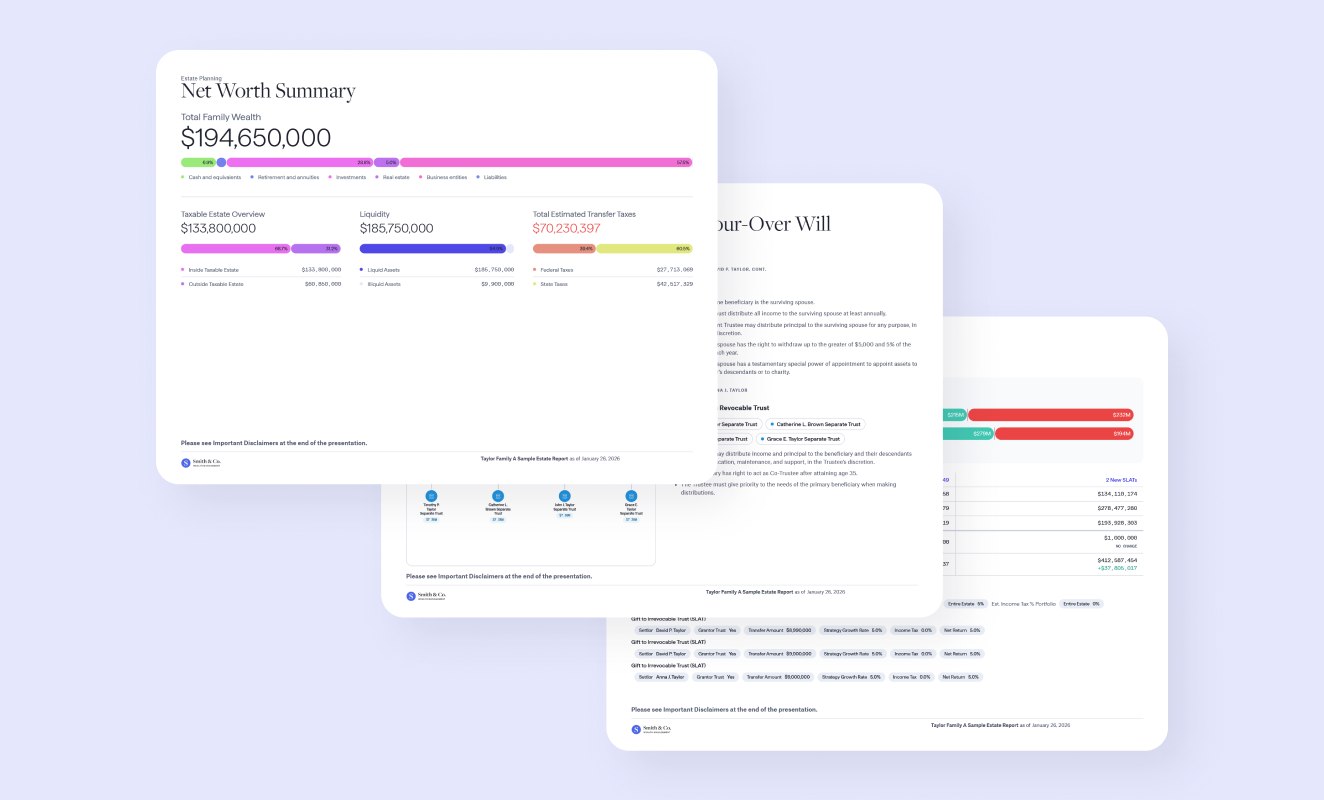
The most valuable part of this conversation centers on bringing everything together. Vanilla’s branded client report connects total family wealth, taxable estate overview, liquidity breakdown, estimated transfer taxes, the trust diagram, and scenario comparisons to help advisors offer a clear picture of where the client stands and the impact of their planning.
Estate planning visuals simplify complexity
For clients approaching or above the estate tax threshold, estate planning strategies often involve GRATs, SLATs, charitable vehicles, or annual gifting programs that can be difficult to explain with clarity.
Consider the mechanics of a GRAT:
- Assets transfer to trust
- Annuity paid back to the grantor
- Appreciation passing to beneficiaries outside the taxable estate
The structure requires clients to hold multiple moving parts in their head simultaneously. A diagram eases the mental burden, showing the structure and associated numbers, as well as what the estate looks like with or without the strategy, giving the client the understanding they need to ask the right questions and make informed decisions.
The elements of an effective estate planning flowchart
Not all diagrams drive better conversations. Trying to show everything at once will simply overwhelm clients, while staying too high level fails to connect information with the specific impact it will have on the client’s financial picture. Estate planning flowcharts should:
- Be built from real data: Generic trust illustrations help to educate, but a diagram built from the client’s documents showing their family’s asset flow and estate tax exposure drive real decision-making.
- Adapt to the client’s level of complexity: Mass affluent clients benefit from clean, intuitive visuals like family trees and asset flow diagrams, while higher-net-worth clients may require layered views with tax exposure, trust structures, and scenario modeling.
- Layer in details deliberately: For example, funding amounts, fiduciary names, and advisor notes should be able to be toggled on or off depending on the conversation. A first meeting with a prospect calls for a different level of detail than an annual review with a long-term client.
Pair the visual with a concrete takeaway: While a diagram or flowchart helps anchor the meeting, a branded report the client can take home to share with a spouse, an adult child, or an attorney facilitates awareness and potential action after the conversation.
Estate planning visualization software deepens client relationships
Our research found that easy-to-understand visuals were the most important factor in influencing clients to hire an estate advisor. Winning and retaining business at this level requires advisors to connect the estate plan to the full financial picture.
Vanilla generates dynamic, client-specific diagrams directly from estate documents and financial data already in the platform. Visuals update automatically as the plan or the client’s situation changes, so every review meeting can start with a current, complete picture of the client’s estate, including estate distributions, trust diagrams, tax exposure, and scenario comparisons.
Conversations that used to require hours of preparation, or didn’t happen at all, naturally become a standard element of every client relationship.
Discover how Vanilla’s flowcharts help you turn estate planning strategies into clear, client-ready visuals that build trust and drive action. Schedule a call with our team to get a demo.
The information provided here does not constitute legal, financial, or tax advice. It is provided for general informational purposes only. This information may not be updated or reflect changes in law. Please consult with an estate attorney, financial advisor, or tax professional who can advise as to your particular situation.
Published: May 28, 2026
Holistic wealth management starts here
Join thousands of advisors who use Vanilla to transform their service offering and accelerate revenue growth.